Systems thinking cheat-sheet
Sharing my systems thinking cheat-sheet, in case people may find it useful.
Systems thinking is a discipline focusing on relationships, feedback loops, and the broader context rather than isolated events or components.
Systems thinking helps us see a situation; Mental Models Toolkit helps us decide within it.
Core concepts
| Concept | What it means | Example |
|---|---|---|
| Stocks and flows | What accumulates, and what fills or drains it | Trust, technical debt, meetings on the calendar |
| Reinforcing loop | More causes more | Growth, viral spread, a vicious cycle |
| Balancing loop | The system pushes back toward a level | A thermostat, a budget cap, people’s tolerance for noise |
| Delay | The gap between cause and effect; it makes people overreact because the fix doesn’t seem to work | Pushing harder on a change that just hasn’t landed yet |
| Boundary | What you’ve chosen to count as inside the system; most mistakes come from drawing it too tight | Designing for the agent-summoner and forgetting about observers in a group chat |
| Emergence | Behavior that comes from interactions and that no single part intended | Nobody designs meeting overload |
| Leverage point | Where a small change has a large effect | Changing a rule or default instead of asking people to try harder |
System Archetypes
System archetypes are recurring patterns of behavior in systems that can help us understand and address complex problems. These archetypes are based on the idea that every action triggers a reaction, known as feedback, which can be either reinforcing (amplifying) or balancing (stabilizing) . By identifying these archetypes, we can find leverage points to make efficient changes in a system.
| Archetype | The shape |
|---|---|
| Fixes that fail | A quick fix works, then makes the problem return worse |
| Shifting the burden | A symptomatic fix stops anyone building the real capability |
| Limits to growth | Growth hits a constraint that wasn’t visible early |
| Tragedy of the commons | A shared resource is overused because each person benefits individually |
| Success to the successful | Whoever wins early gets more resources, so they win again |
| Escalation | Two parties keep responding to each other, each raising the stakes |
| Eroding goals | When performance falls short, the standard drops |
Causal loop map
A visual representation used to illustrate the relationships and feedback loops within a system. It is commonly used to analyze how different variables influence one another, either positively or negatively, and to identify reinforcing or balancing feedback loops.
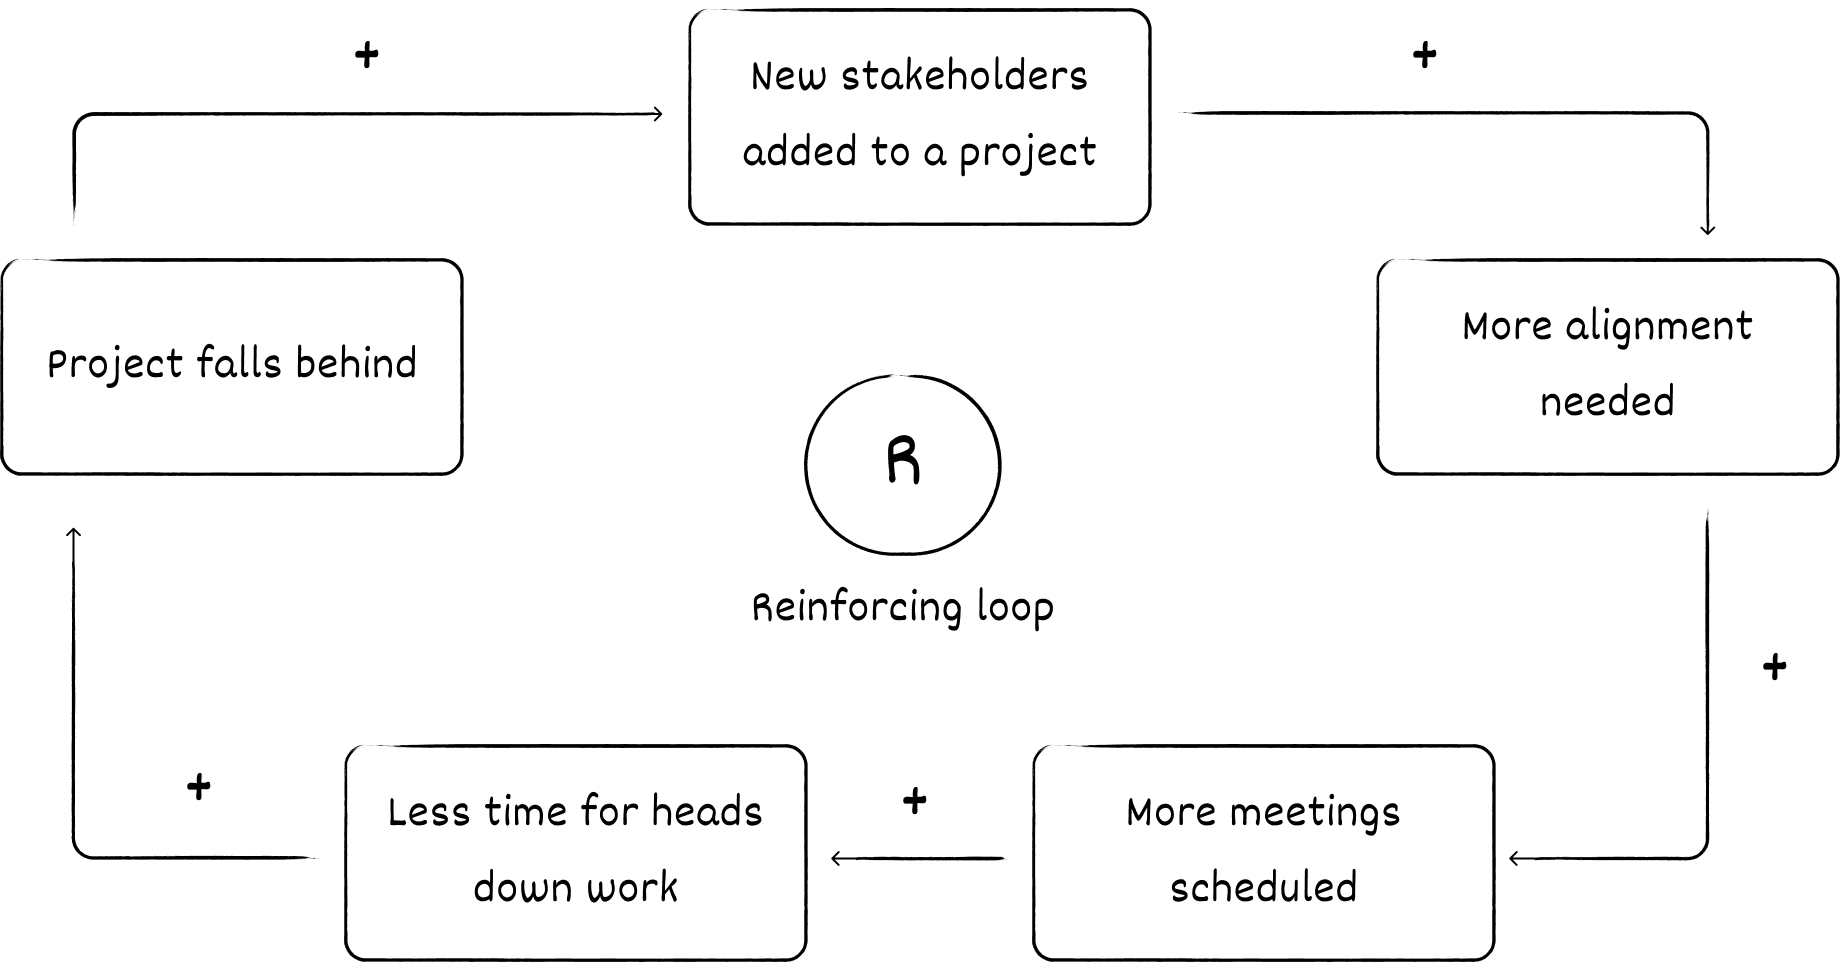
- + (Positive Causation): An increase in one variable leads to an increase in the other, or a decrease leads to a decrease.
- - (Negative Causation): An increase in one variable leads to a decrease in the other, or vice versa.
- Reinforcing Loops (R): Amplify changes in the system, leading to exponential growth or decline.
- Balancing Loops (B): Counteract changes, promoting stability or equilibrium.
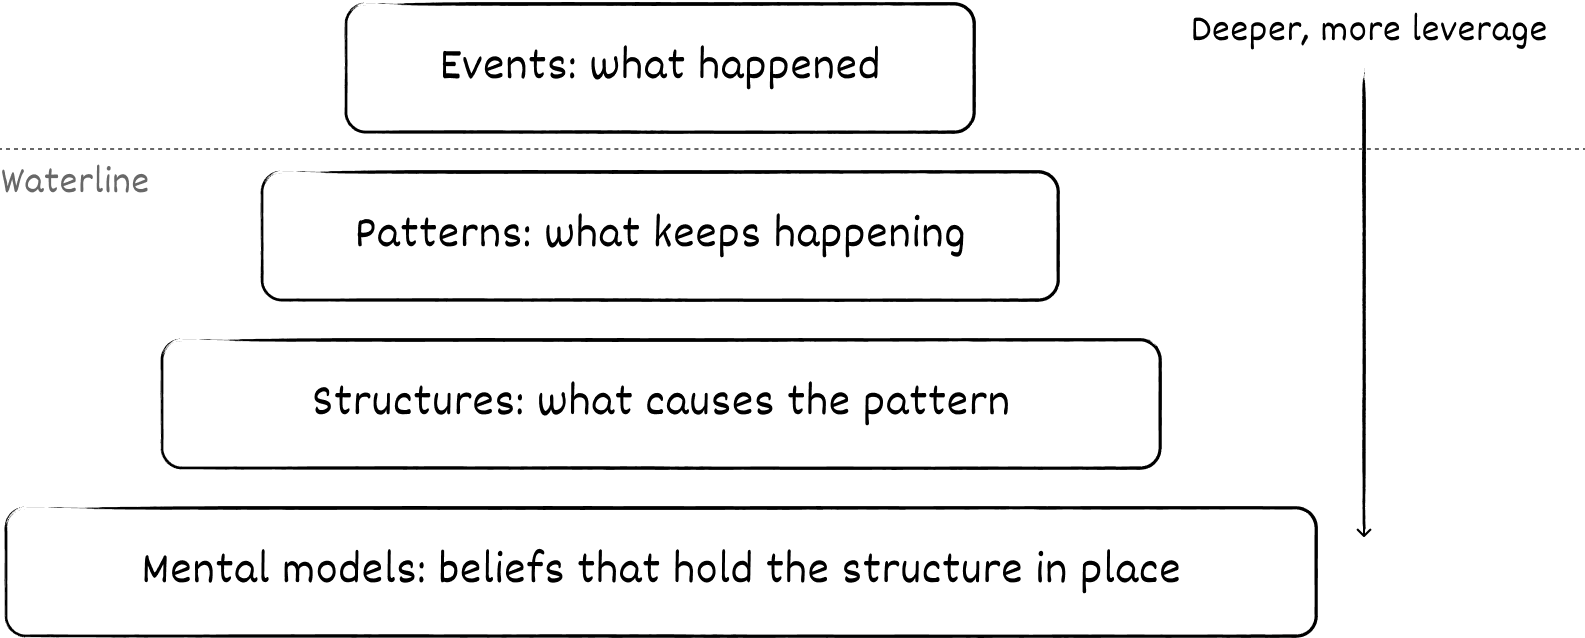
The Iceberg model
Above the waterline is what people see and react to. Lasting change comes from altering a structure or a belief below it, so the deeper the layer, the more leverage a change has.